How to – Embed Canvas App in an Iframe inside Dynamics 365


Canvas App can be easily embedded in a web site using the Iframe.

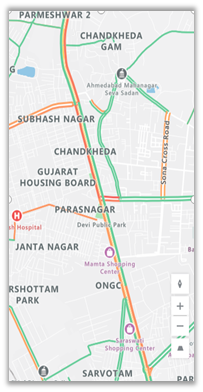
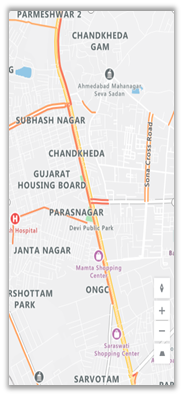
Say e.g. we have the following Canvas App to be embedded inside Dashboard in Dynamics 365

Save the app and navigate to Details

We can copy the Web link or App ID.

The URL Format –

https://apps.powerapps.com/play/[appId]

The other parameter that can be used are

source, tenantid, screencolor and any additional parameters

e.g.

https://apps.powerapps.com/play/[appId]?source=iframe&screenColor=rgba(120,110,55,1)&param1=value&param2=value 2

  • Here we have embedded it inside an Iframe component within the Dashboard

Publish the change and navigate to the Dashboard, we can see our Canvas App.

If the application is using Azure Active Directory-based authentication, the user will not be asked to sign-in again, else the user will be asked to Sign-in and will be able to access the app if it is shared with them.

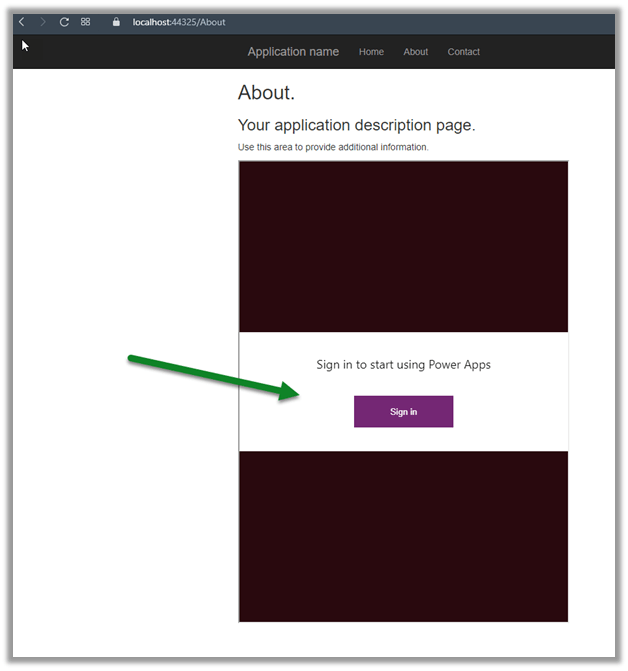
Here we have embedded it inside an ASP.NET page, and we are asked to Sign-in.

After successful sign-in

Get all the details here –

https://docs.microsoft.com/en-us/powerapps/maker/canvas-apps/embed-apps-dev

Hope it help..

Advertisements

Traffic information in the map component – 2020 Release Wave 2


The interactive Map component (preview) can now be enabled to show traffic information like traffic congestion, incidents, traffic flow using red, yellow, and green colors.

Before we can use the Map component (preview), we need to first enable it for the environment.

Navigate to the admin portal –

https://admin.powerplatform.microsoft.com/

Within features, enable the Geospatial services and save the setting.

Else we would be getting the below error while trying to add the map component to the canvas app screen.

Here we have added the map component.

And updated the default location.

Scrolling down within the properties pane, we can see the properties specific to traffic information.

  • Show traffic incidents – On / Off.
  • Traffic flow types – None, Relative, Relative Delay only.

Below is how it renders for different values for traffic flow types.

Traffic flow type = none

No data is shown

Traffic flow type = relative

Relative data to the free-flow of the road

Traffic flow type = relative-delay

Areas that are slower than average expected delay

More on Map component –https://docs.microsoft.com/en-gb/powerapps/maker/canvas-apps/geospatial-component-map

Hope it helps..

Sub grid and form tabs improvements in Power Apps Mobile App


There are couple of improvements in user experience for sub grids and form tab in Power Apps Mobile app.

Check other blog posts on Release 2020 Wave 2

  • Headers are more protruding for sub grid to separate it from rest of the sections of the form.
  • There is also an option (+ New Case – below) to add new record inline for empty sub grids.

  • Commands on sub grid opens as a drawer from the bottom of the screen.

  • Form tabs can be scrolled horizontally and selecting the tab automatically adjusts the header.

Hope it helps..

Error – We don’t support the option ‘HierarchicalNavigation’. Parameter name: HierarchicalNavigation when trying to load table in Power BI Desktop using Azure Data Lake Storage Gen 2 CDM Folder view (beta)


While trying to connect to a table within Azure Data Lake Storage Gen2 through CDS Folder View

we got the below error

Users have reported this issue with the August 2020 Update of Power BI Desktop.

As suggested in the forums, downgrading to June 2020 Update fixed the issue for us.

Check out Export CDS data to Azure Data Lake Storage Gen2

Posts on Azure Data Lake

Hope it helps..

Advertisements

Use Monitor to troubleshoot forms in the model-driven app (preview)– Dynamics 365


The new monitor feature added for the Model-driven apps can be used for troubleshooting issues with form related events.

We have 2 ways to access the monitor option.

Select the Model-driven app inside Power Apps  and select Monitor in the command bar.

The other option is to  add the parameter &monitor=true to the end of the URL

And select the monitor option

This will open the monitoring session in a new tab.

Click on the Play model-driven app.

This opens the app connected to the monitor session.

We can see any action performed tracked.

We can filter Category column to check specific events related to form.

Select the row to get the details populated on the right side.

Get all the details below

https://docs.microsoft.com/en-us/powerapps/maker/model-driven-apps/monitor-form-checker

Hope it helps..

Column Comparison using FetchXML Builder and SQL 4 CDS


Check it out, the column comparison feature is now added in our favorite XrmToolBox plugins (make sure to update to the latest version)

  • FetchXML Builder

https://jonasr.app/2020/07/fxb-july-2020/#more-4374

  • SQL 4 CDS

https://markcarrington.dev/2020/07/15/column-comparisons-in-fetchxml/

Thanks, @Jonas, and @Mark for incorporating it.

Also, refer –

https://www.itaintboring.com/dynamics-crm/we-can-now-do-column-comparison-with-fetchweb-api/

https://prashantmayur.wordpress.com/2020/07/20/use-column-comparison-in-d365-ce-power-apps-cds-queries/

https://debajmecrm.com/2020/07/16/compare-two-columns-in-queryexpression-in-dynamics-365-cds-sdk/

https://nishantrana.me/2020/07/16/the-new-column-comparison-in-queries-in-dynamics-365-powerapps/

Hope it helps..