While testing one scenario we observed one of the plugins (asynchronous) was not updating the record as expected.
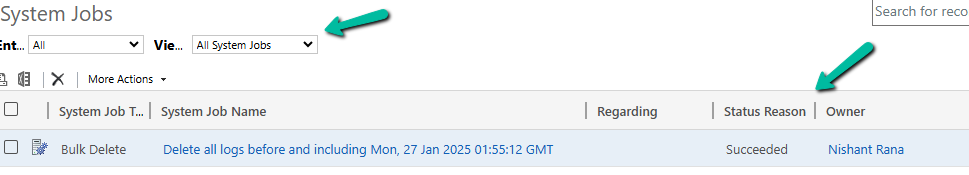
Checking the System Jobs, we saw the below error.
The async operation was skipped because the org is in “Disable Background Processing” mode.
Well, this was because we had recently created this environment by copying our UAT environment and had forgotten to disable the Admin mode / enable Background operations.
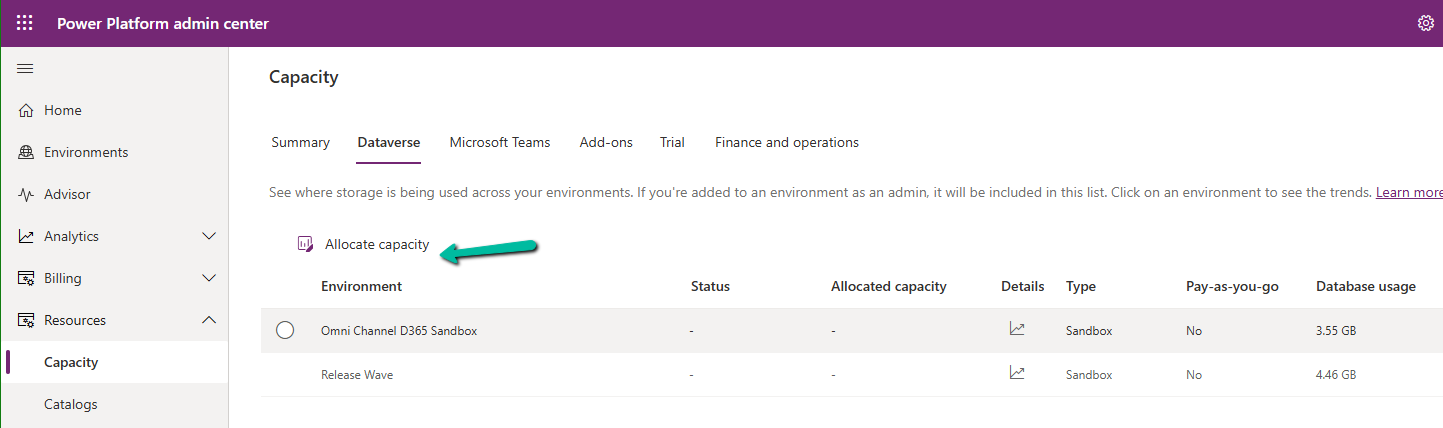
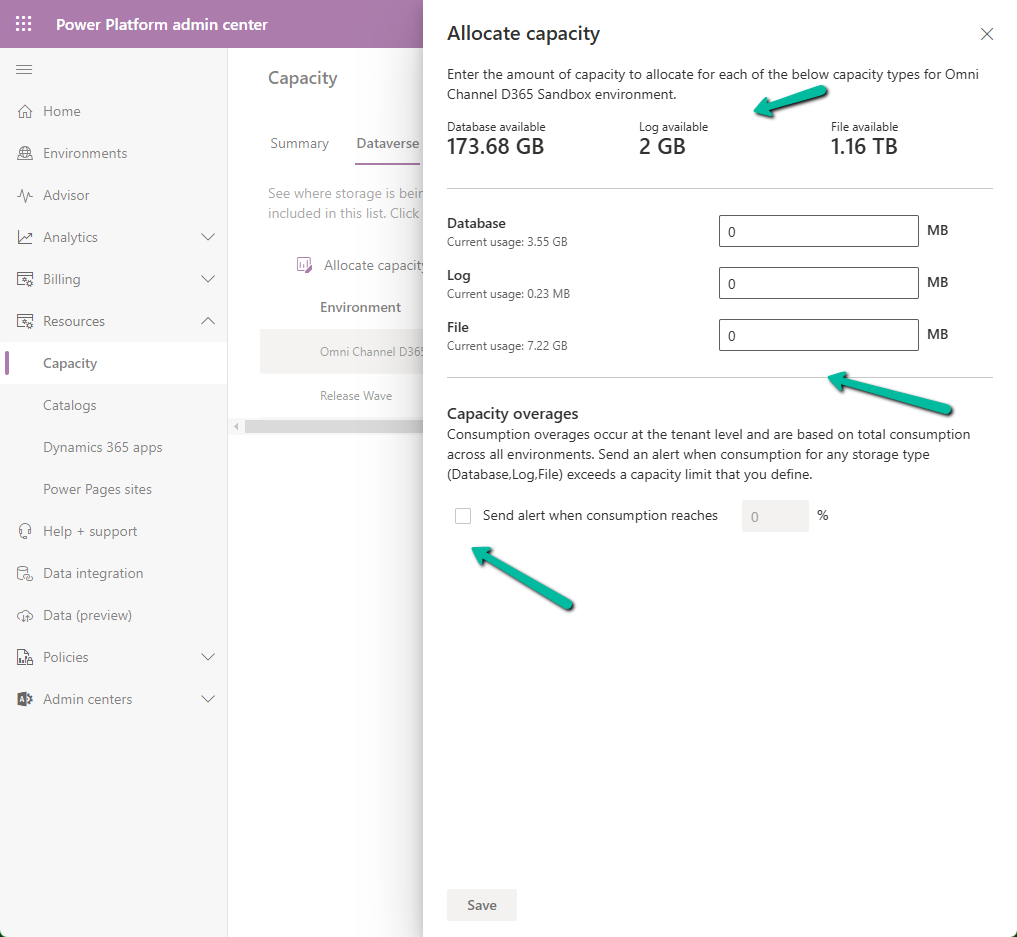
The new Allocate Capacity feature allows administrators to manage and optimize storage allocation across different environments. It allows administrators to strategically distribute available storage among the Dataverse environments based on each environment’s unique needs ensuring each has the right amount of storage to maintain performance and avoid service interruptions.
Navigate to Resources >> Capacity >> Dataverse inside the Power Platform Admin Center and select an environment to make the Allocate capacity option visible.
It shows the available storage, and current usage of the environment selected.
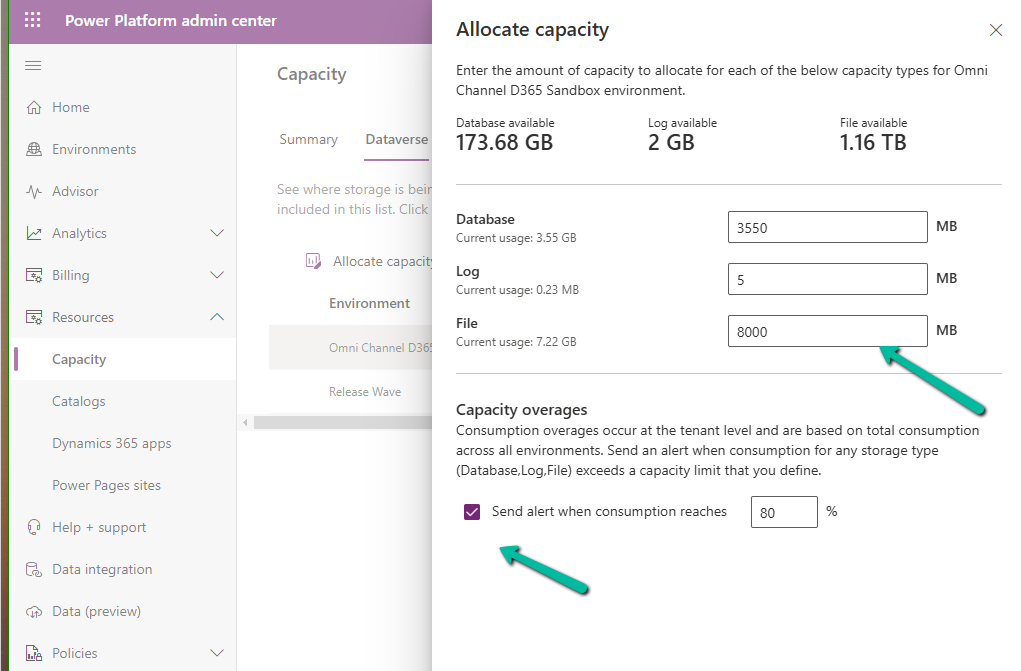
We can allocate Database, Log, and File-specific storage and also configure alerts.
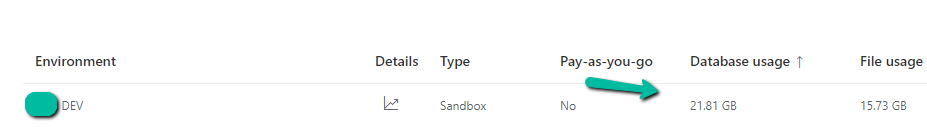
If an environment exceeds, it shows up as “Overage” as shown below
Using this new feature, admins can Allocate Capacity effectively by monitoring the storage usage across environments, setting alerts when the environment nears its capacity limit, and allocating the capacity strategically e.g. production environment will get higher allocation compared to the development environment. Admins can also purchase additional storage and allocate it as required to ensure each environment runs smoothly.
This time we followed more or less the same steps, the main difference was this time we used our favorite XrmToolBox plugin SQL4CDS to perform the delete operations instead of the bulk deletion job.
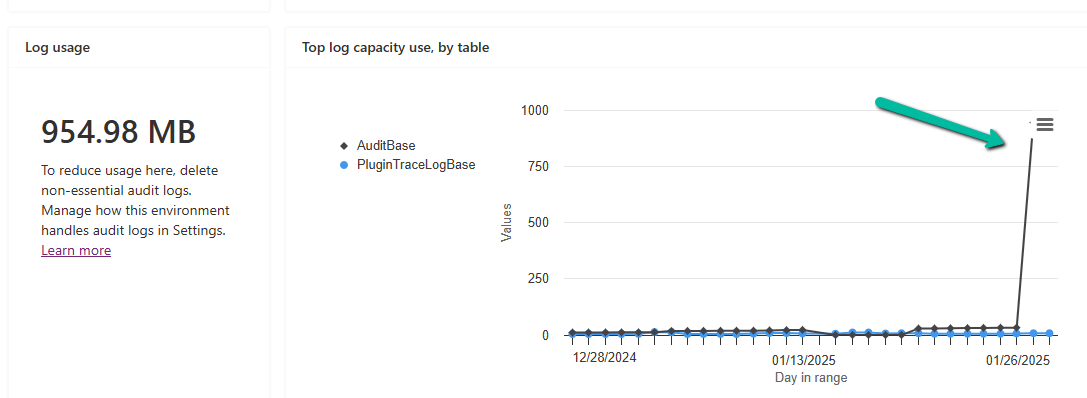
However, even after deleting all the Activity type records (except one appointment record which was giving some error on deletion), as shown below, the ActivityPointer was still showing 13 GB of space occupied.
select activitytypecodename,activitytypecode, Count(activitytypecode) as Total
from activitypointer
group by activitytypecode, activitytypecodename
order by Total desc
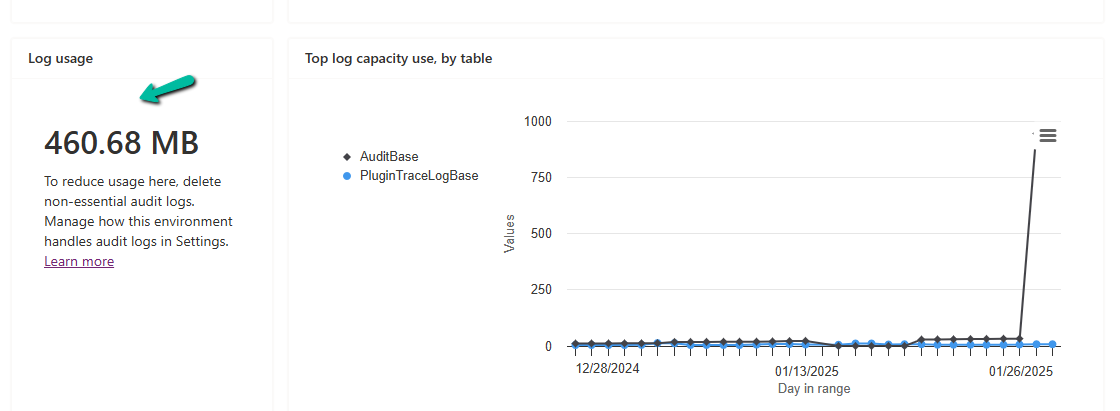
And the same was true for the WorkflowLogBase, we used a bulk deletion job for deleting the system jobs with status as succeeded which deleted around 1200 records, however running the same query in SQL4CDS showed us around 70K records with status as success.
On trying to run the following query it gave us an “Expected non-empty Guid” error and we could not delete the records.
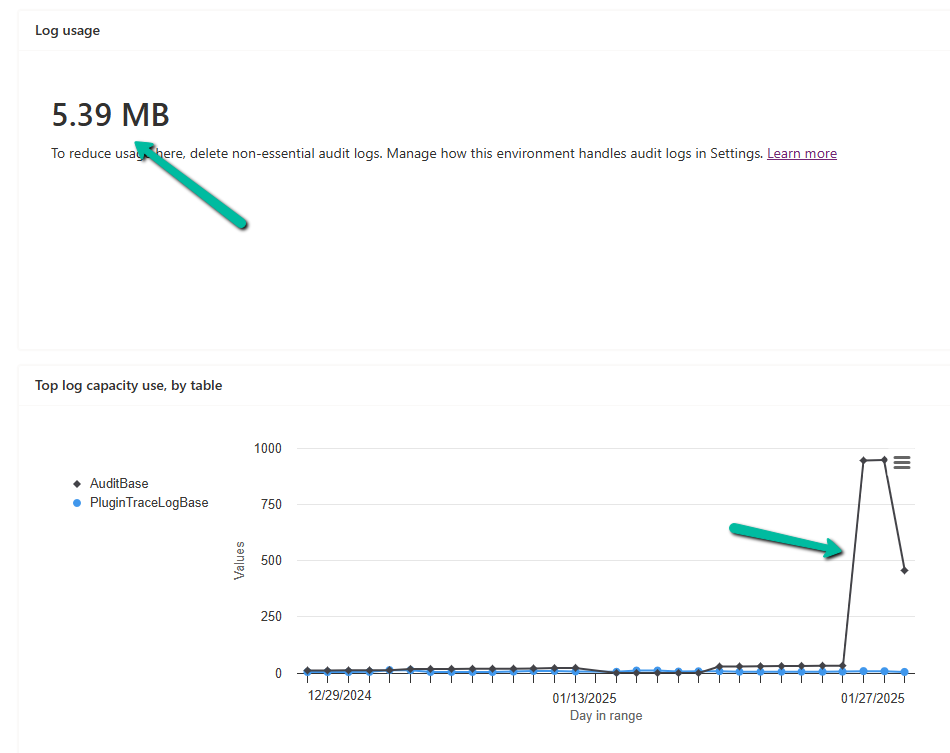
Eventually, we raised the Support Ticket for it, and the team ran the script in the background to delete/reduce the size of the Activity Pointer and Workflow Log table and eventually we were able to reduce the database usage (we also deleted few other table records)
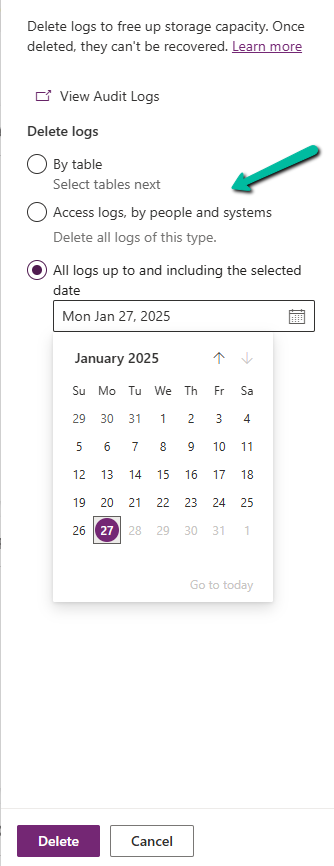
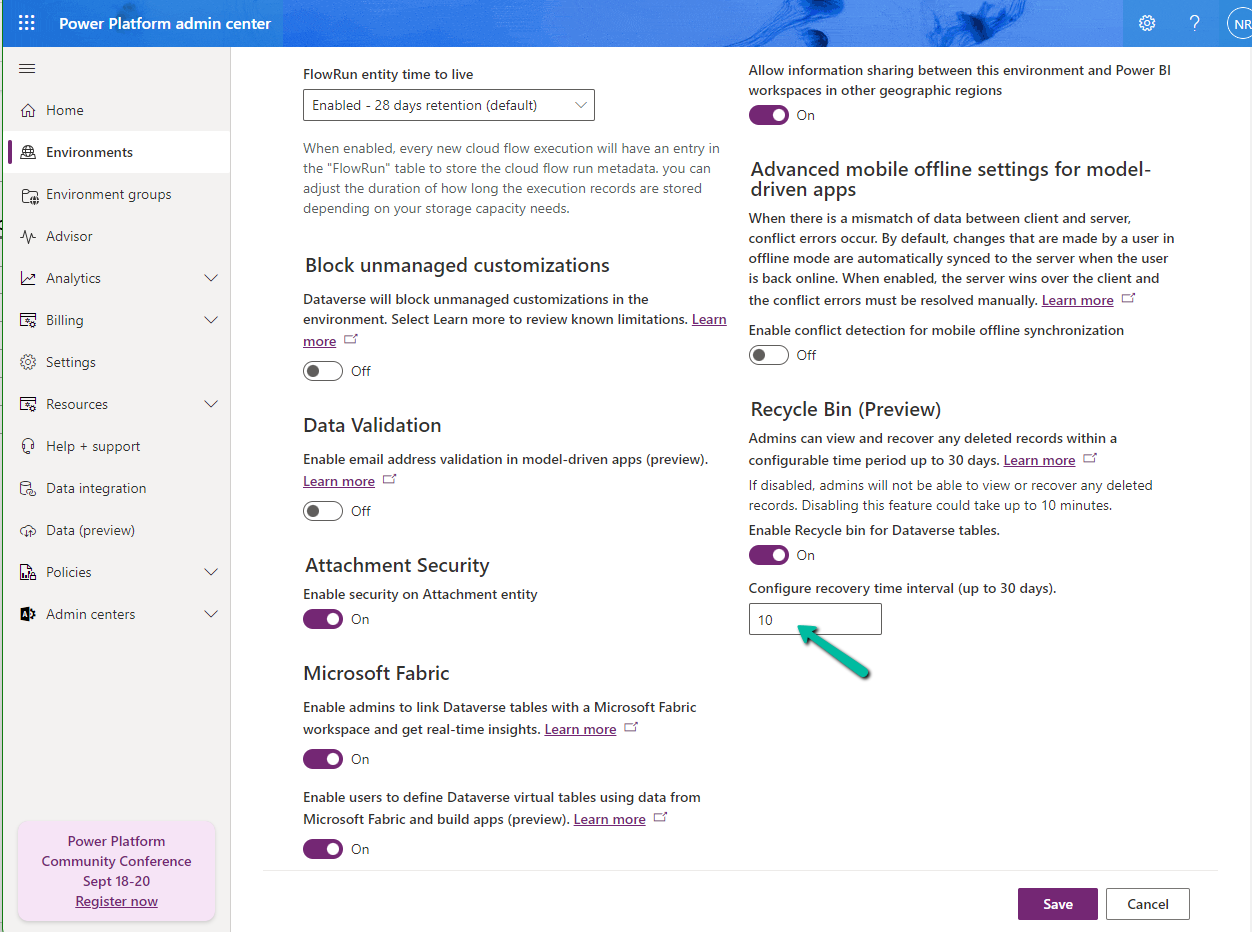
We can specify 30 days as the maximum recovery time.
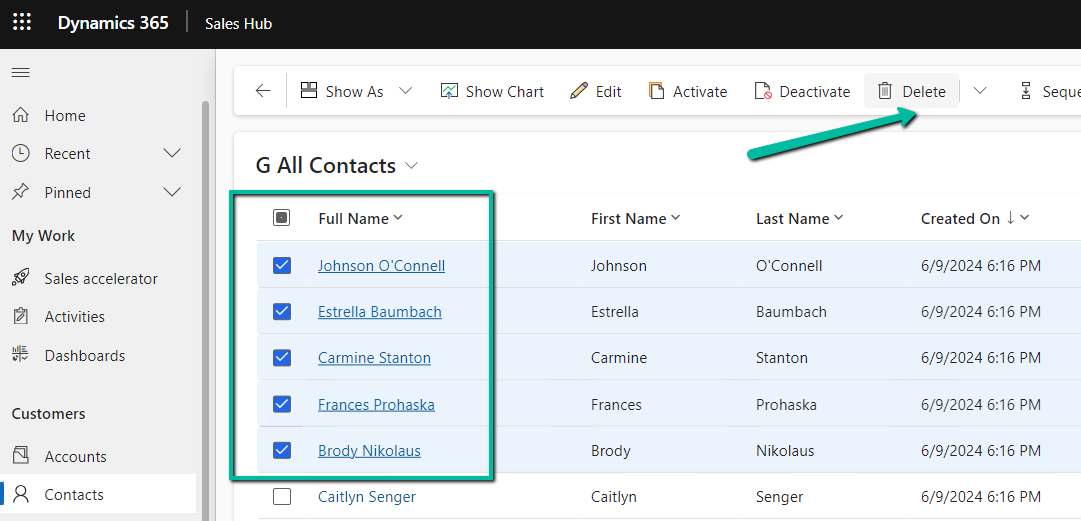
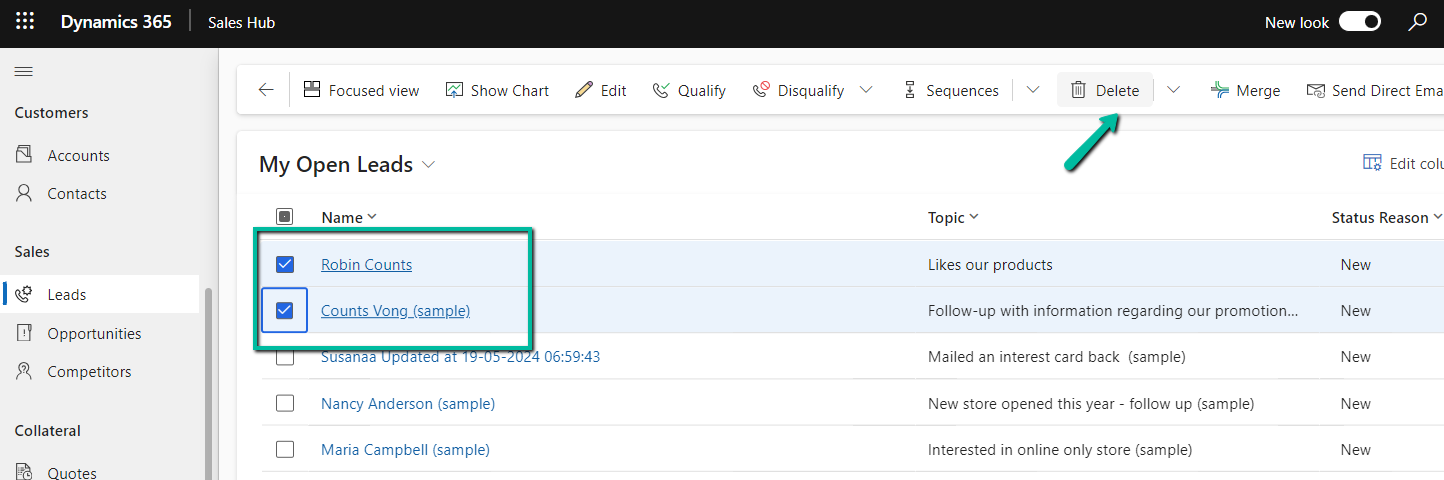
Let us delete some of the contact and lead records.
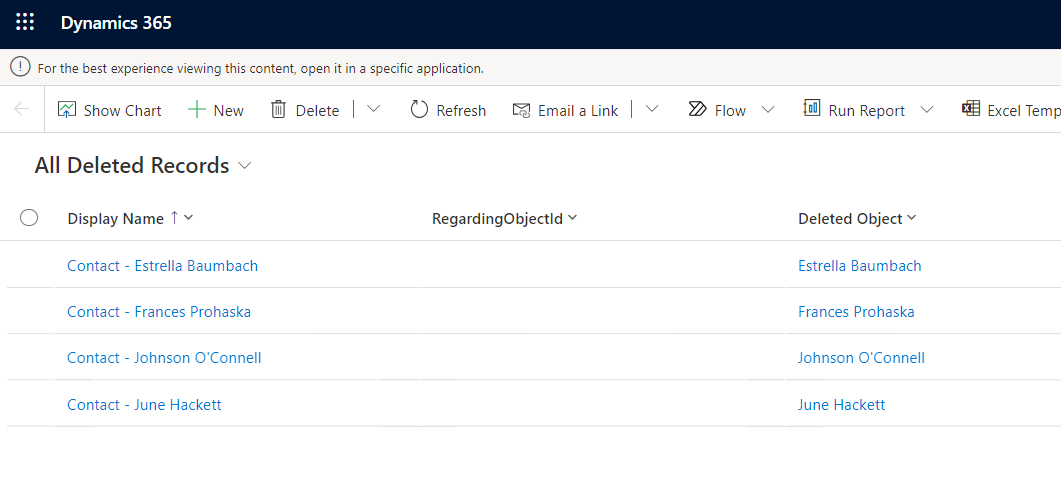
Navigate to Environment >> Settings >> Data Management >> View Deleted Records to view the deleted records.
We can select the records and click on Restore to get the deleted records back
We can see the records removed from the Deleted Records view.
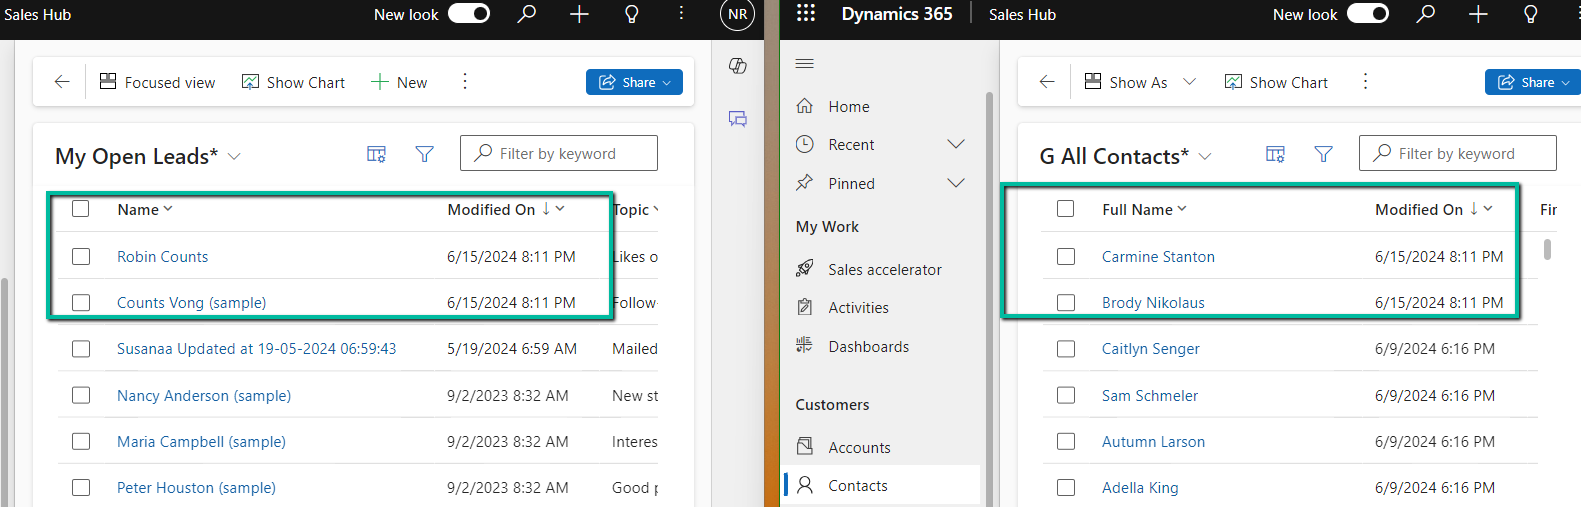
Below we can see the restored records – we can also see the Modified On updated.
The feature applies at the environment level, we cannot specify it for individual tables currently. Only the main deleted record and related records deleted via the cascaded relationship behavior will be restored. If a related record is deleted as part of custom business logic, it will not be restored.
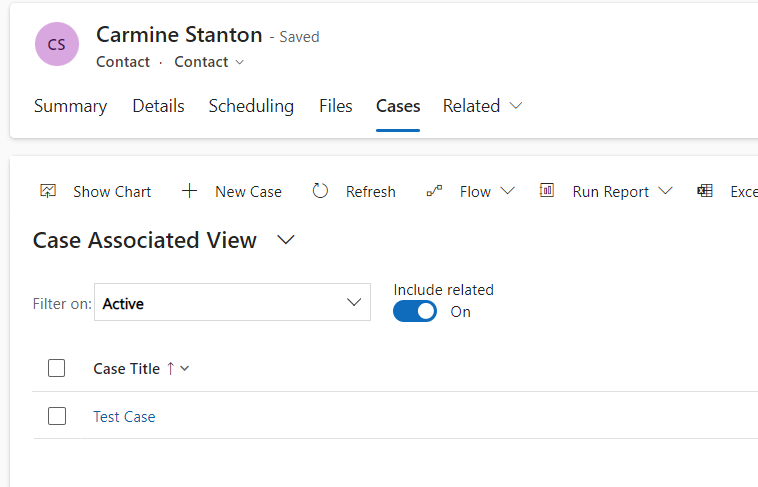
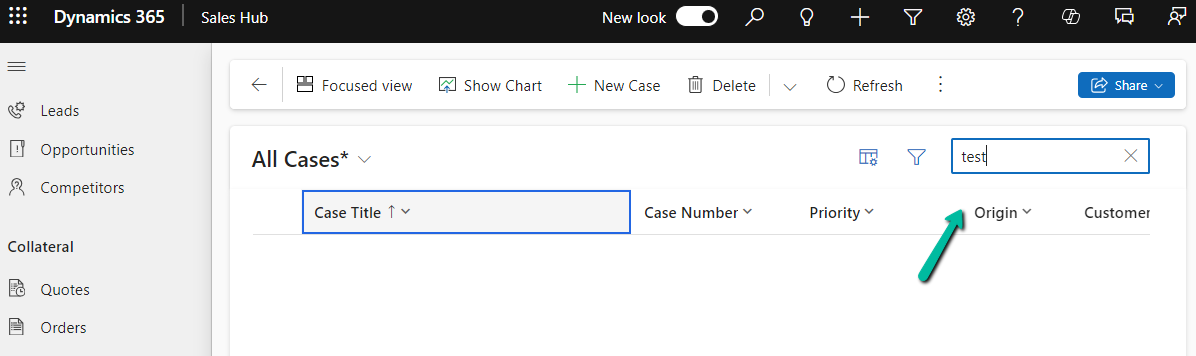
Below let us delete the Contact record which has a case and an opportunity record associated.
On deleting the Case the child case and lead records also get deleted.
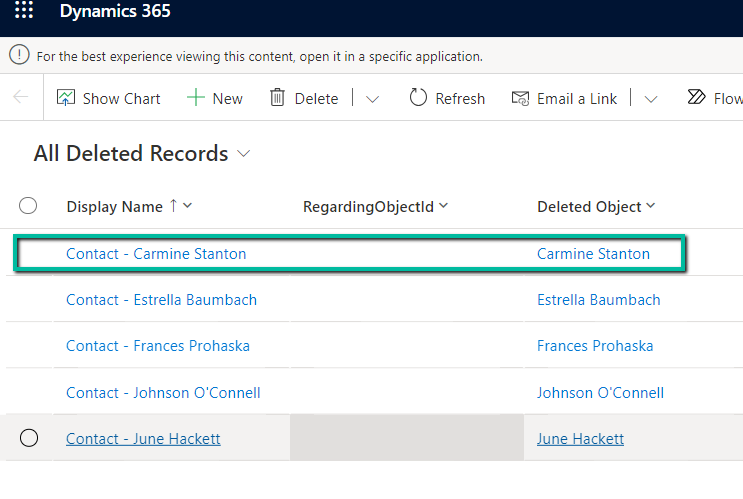
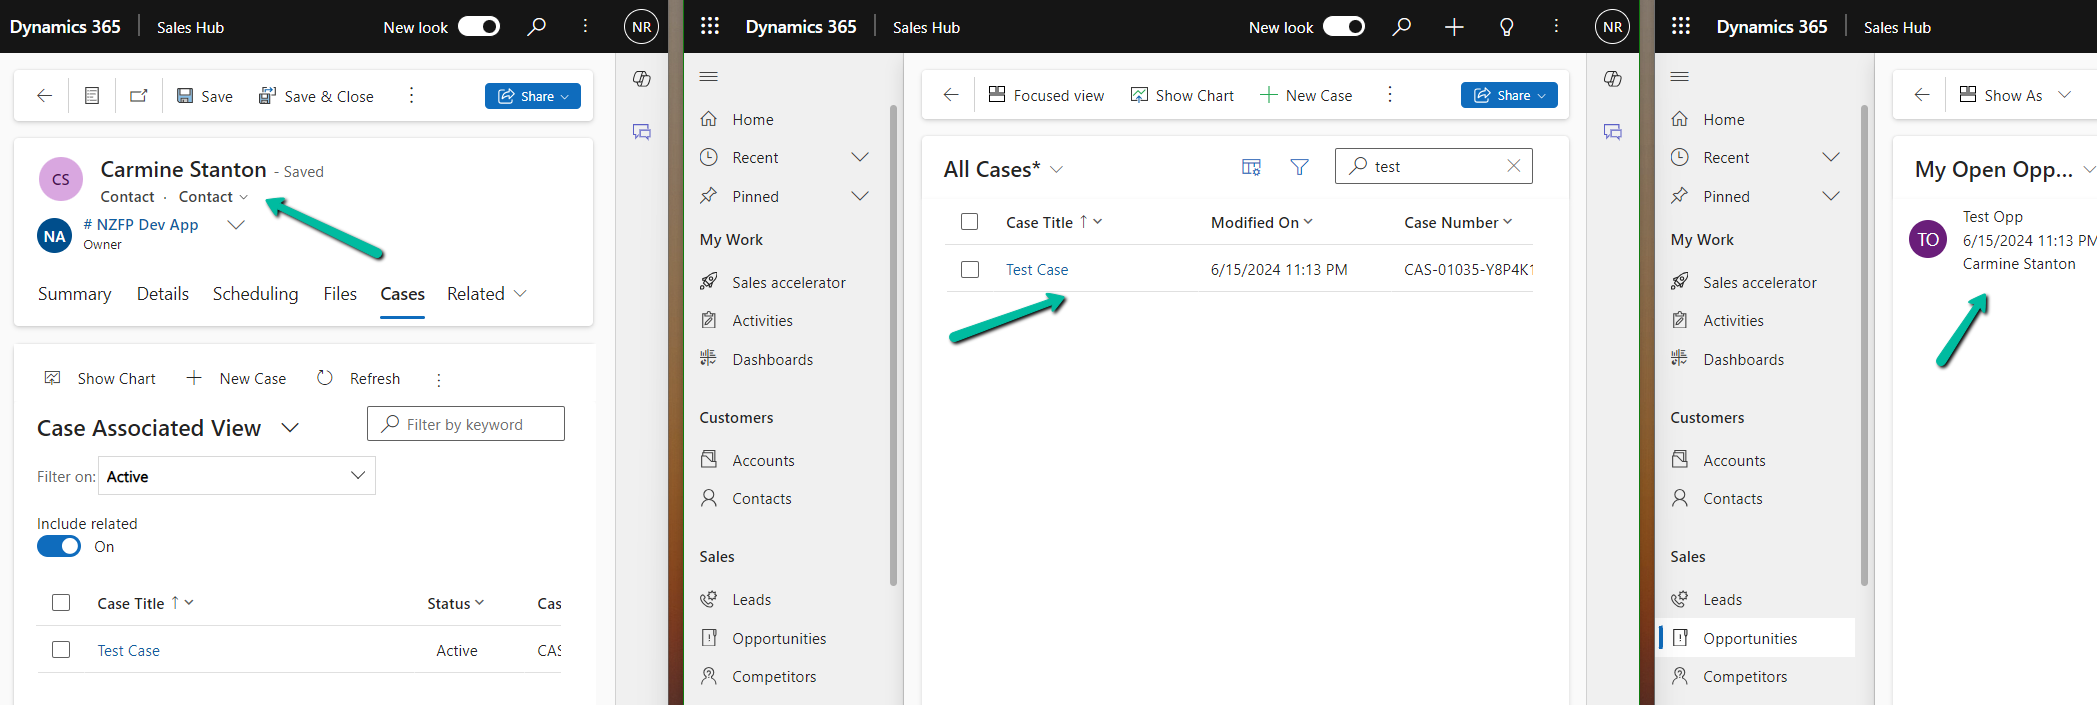
However, we do not see those records in the Deleted records list only the main (parent) Contact record.
On restoring the deleted contact restores the child case and opportunity record also.
While trying to enable Admin Mode for one of our Dataverse Environments,
we got the below error
“This operation cannot be performed because there is an active lifecycle operation on the environment”
This was because we had a copy operation going in the background, we were copying that particular environment to another environment.
After the copy operation was completed (around 1 hour, for the environment DB Usage – 45 GB, File Usage – 118 GB, and Log Usage – 21.63 GB), we were able to switch on the Admin mode.