Visualize Data in a View with Copilot (Preview) – Dataverse / Dynamics 365


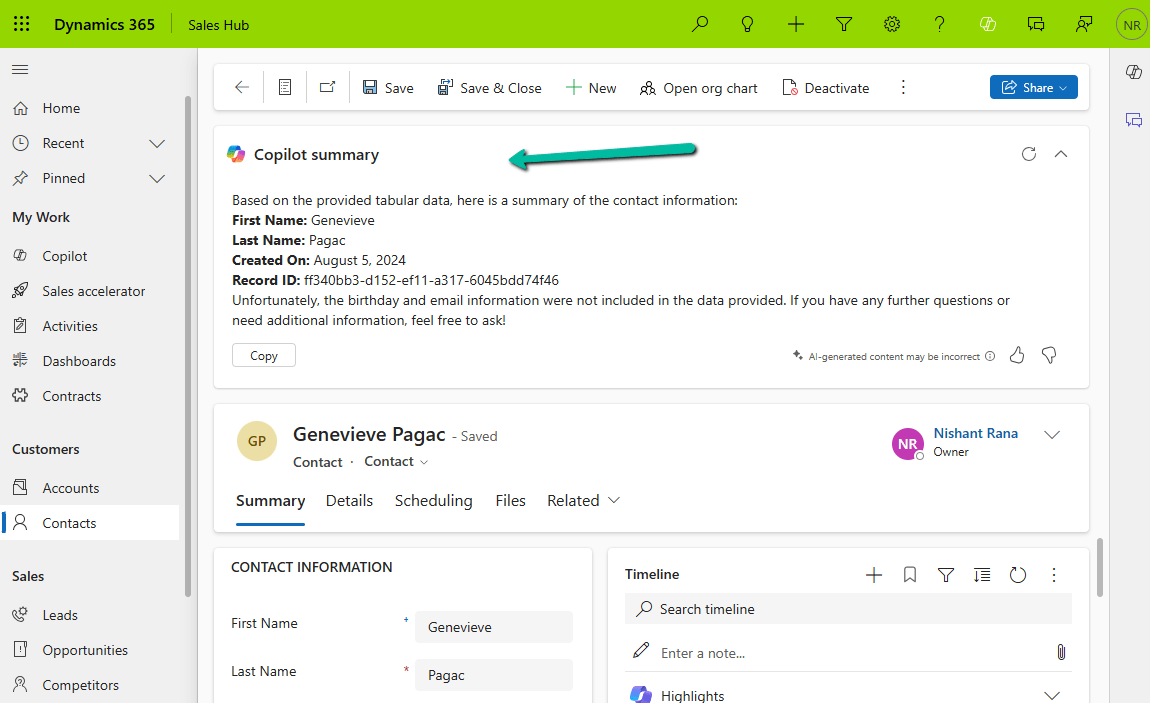
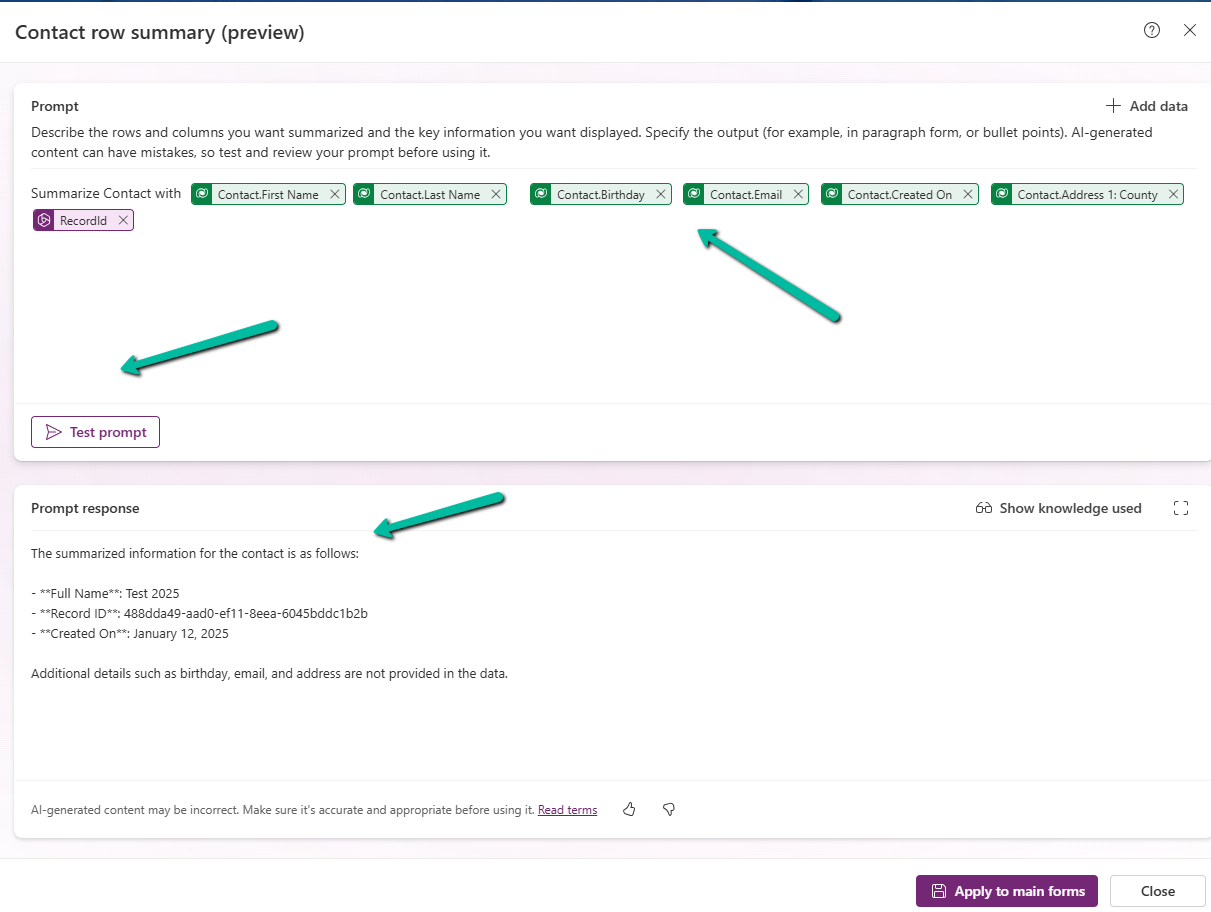
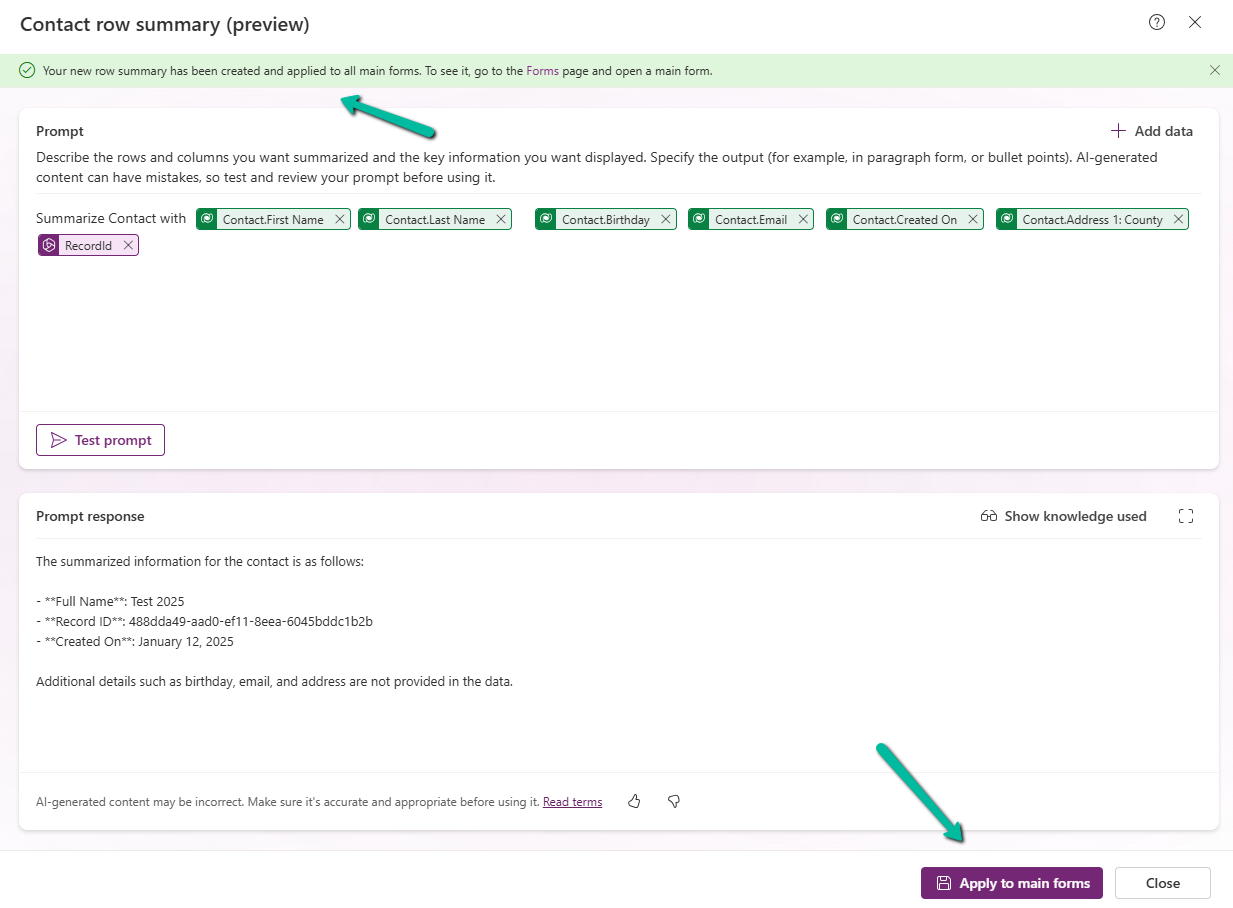
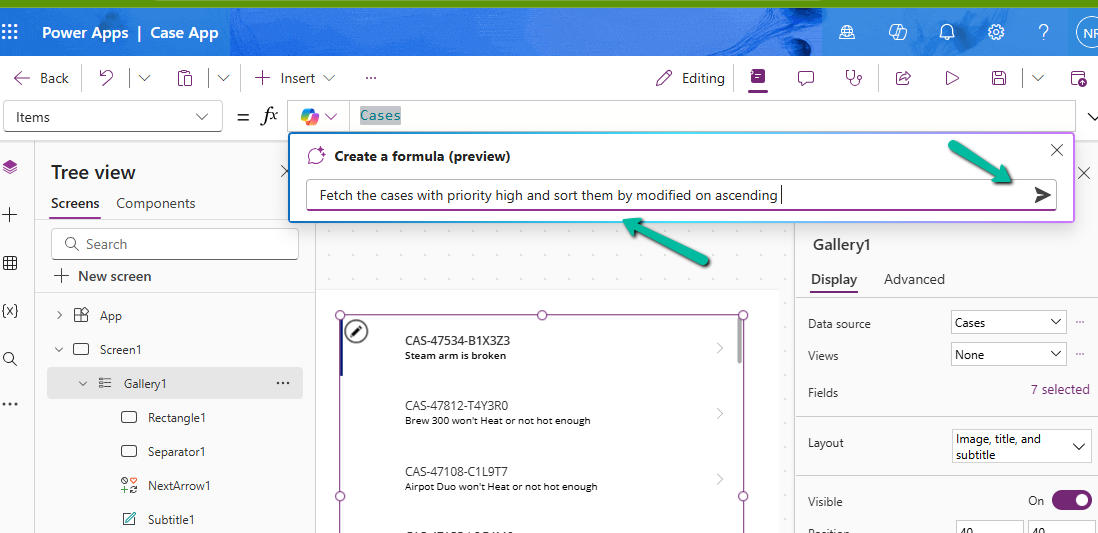
The copilot-powered data visualization in views feature, currently in preview, allows us to generate quick and insightful charts from Dataverse table views using natural language. We can select a table view and ask Copilot to generate visualizations, making data interpretation easier.

  • Natural Language Queries – Ask Copilot in simple terms to generate relevant charts.
  • Multiple Chart Types – Bar charts, pie charts, line graphs, and more.
  • Instant Insights – No need to build reports; visualize directly from your data view.
  • Interactive Refinements – Modify the chart type or tweak the data selection.

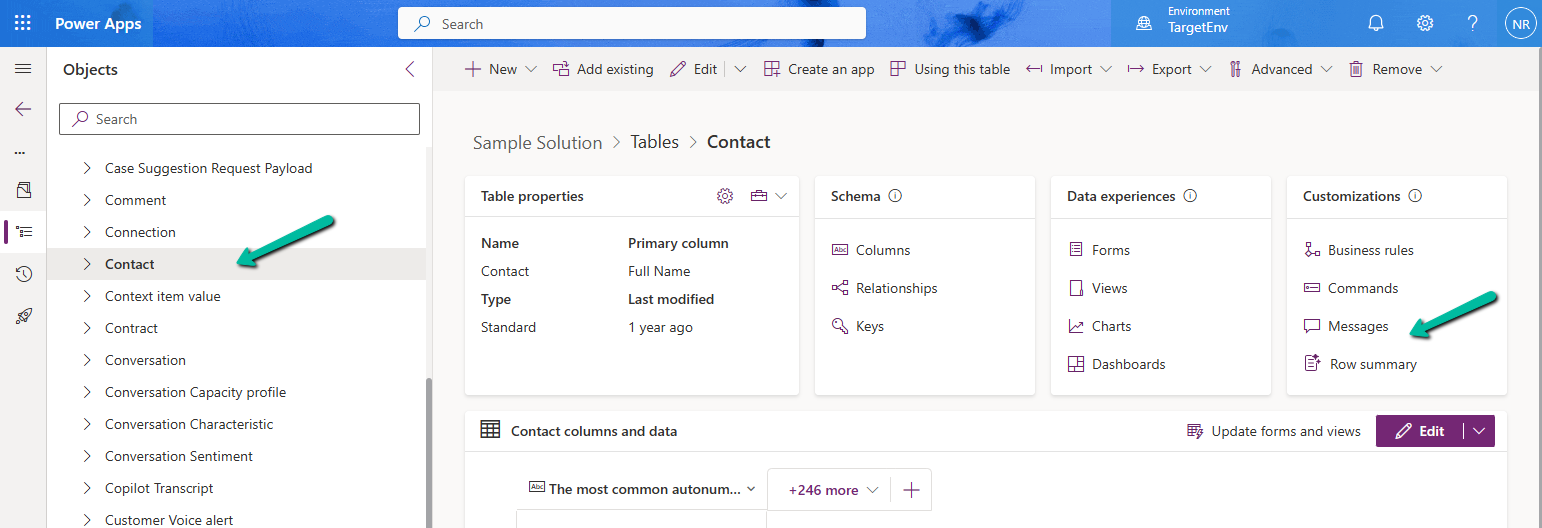
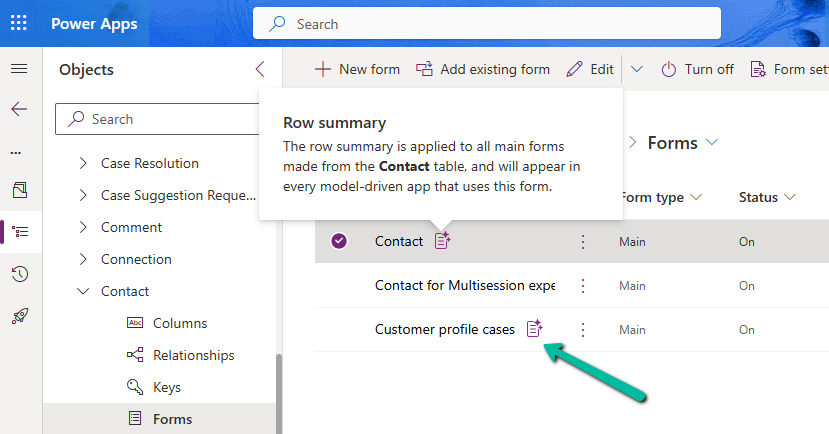
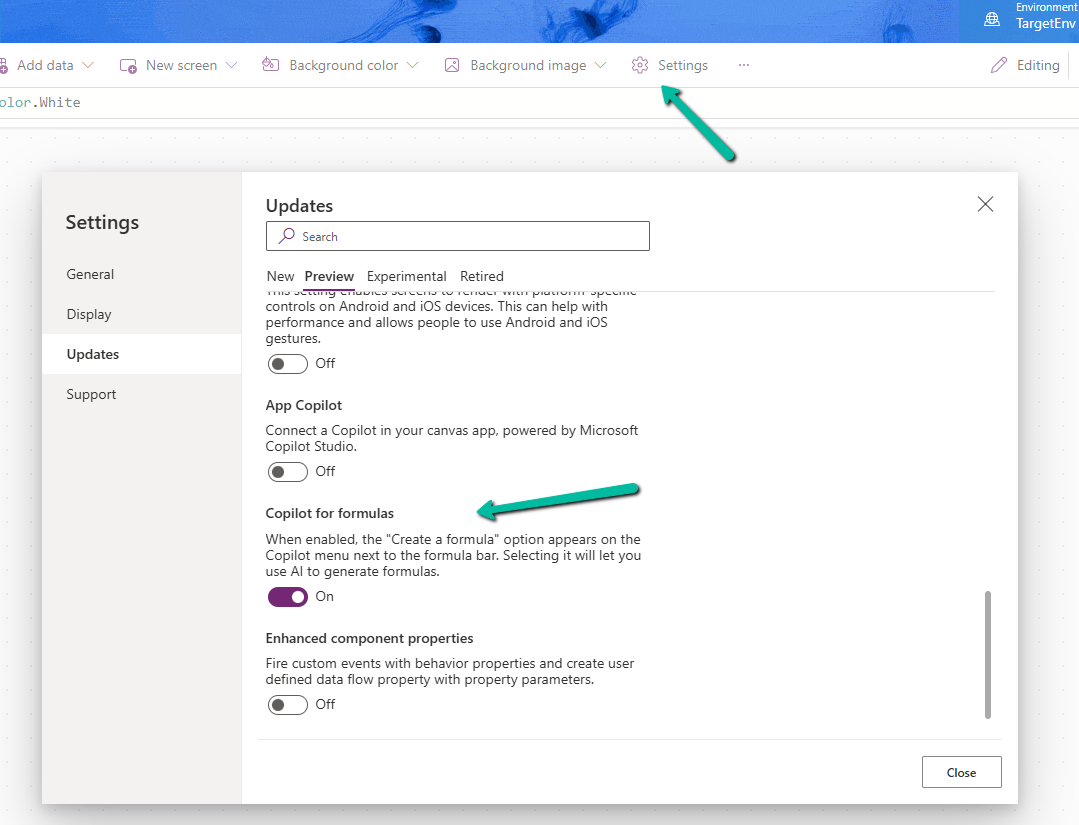
To enable it, for the environment, navigate to Settings >> Features and enable Natural Language Grid and View Search.

We can see the Visualize button added to the views.

A screenshot of a computer

AI-generated content may be incorrect.

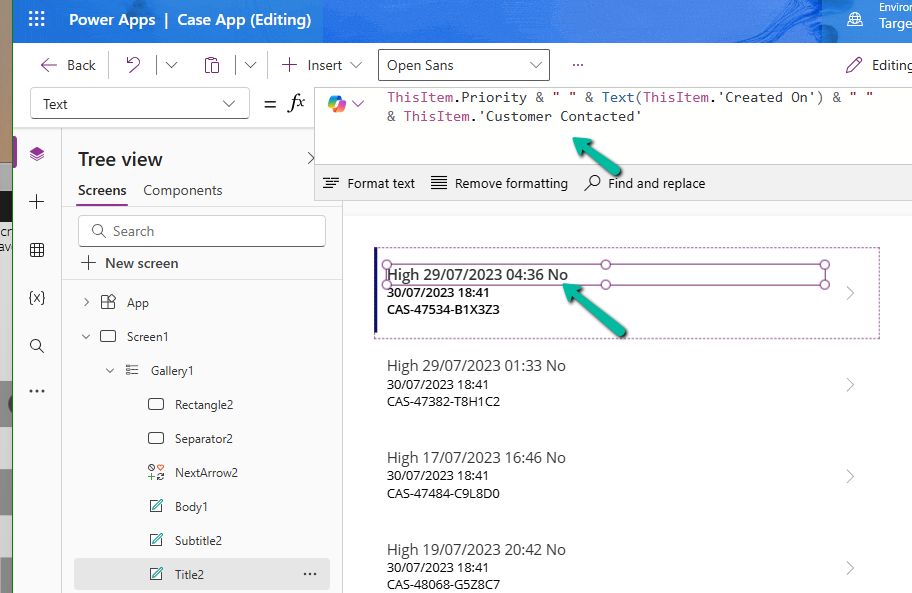
It generates the Chart based on the data in the view.

A screenshot of a computer

AI-generated content may be incorrect.

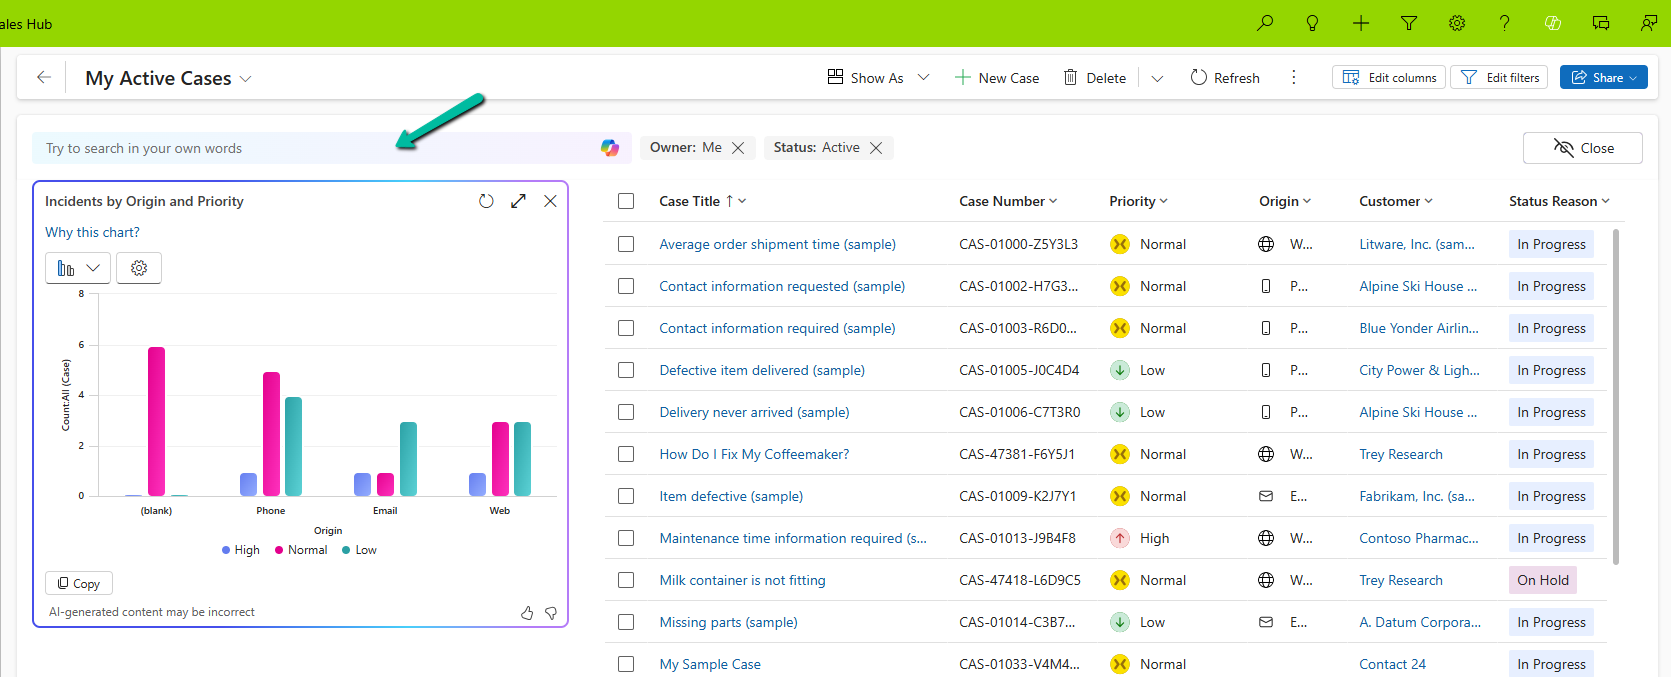
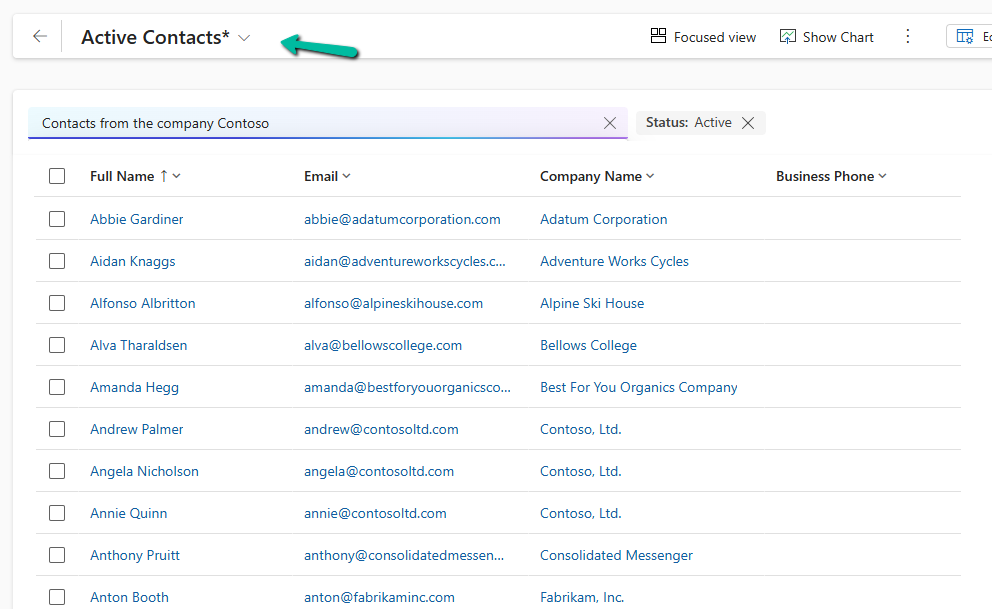
Selecting a particular area filters the data in the view accordingly.

We also have the option to change the chart type, copy the chart, expand the view, etc.

A screenshot of a computer screen

AI-generated content may be incorrect.

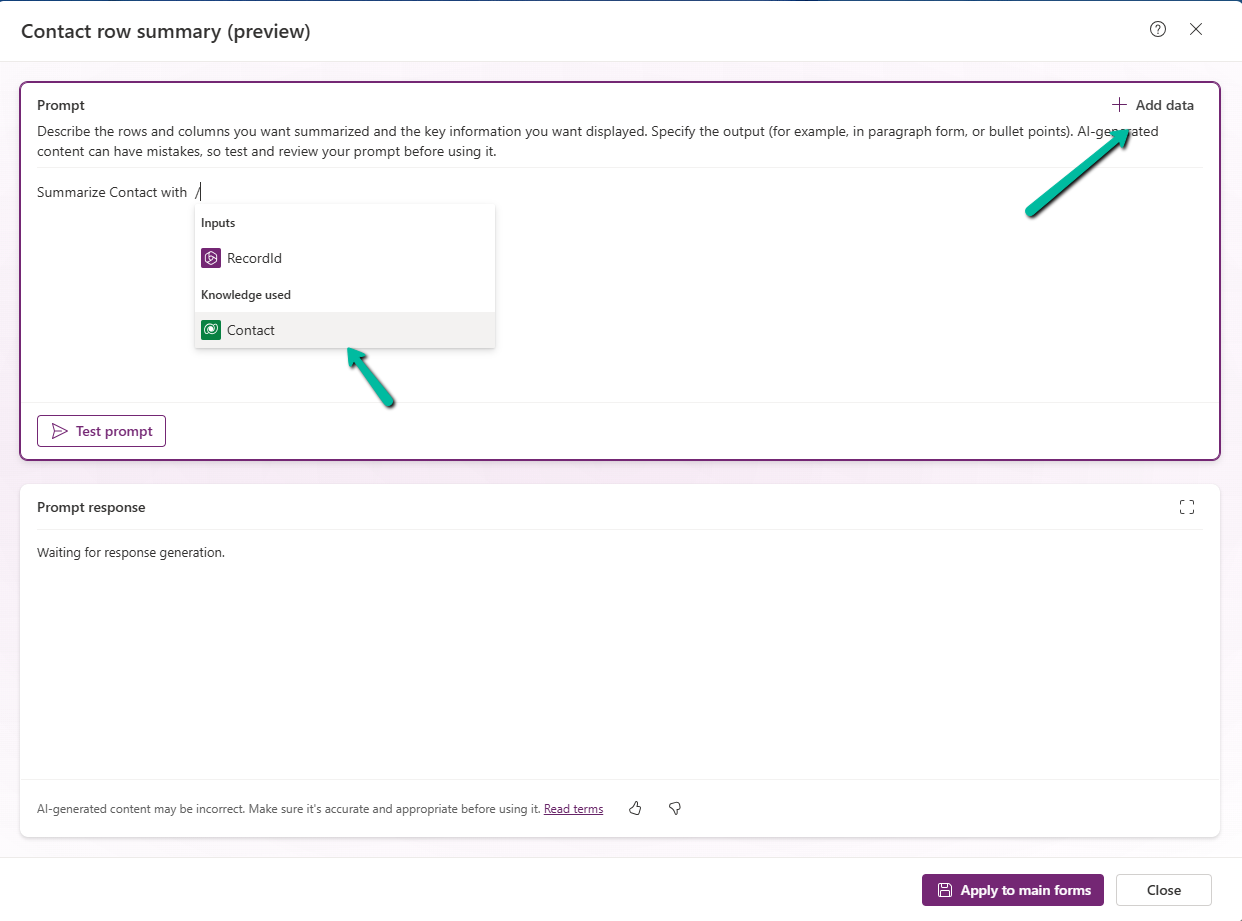
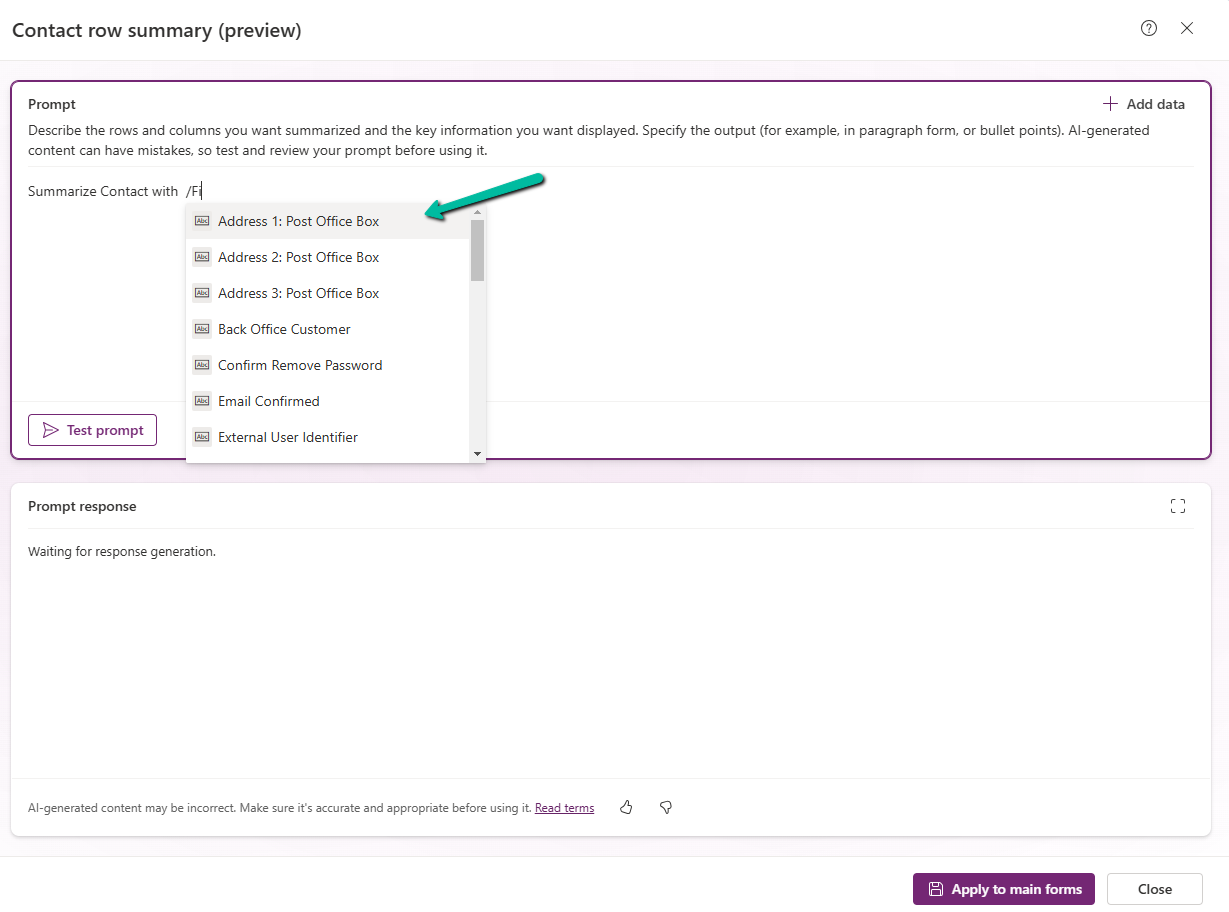
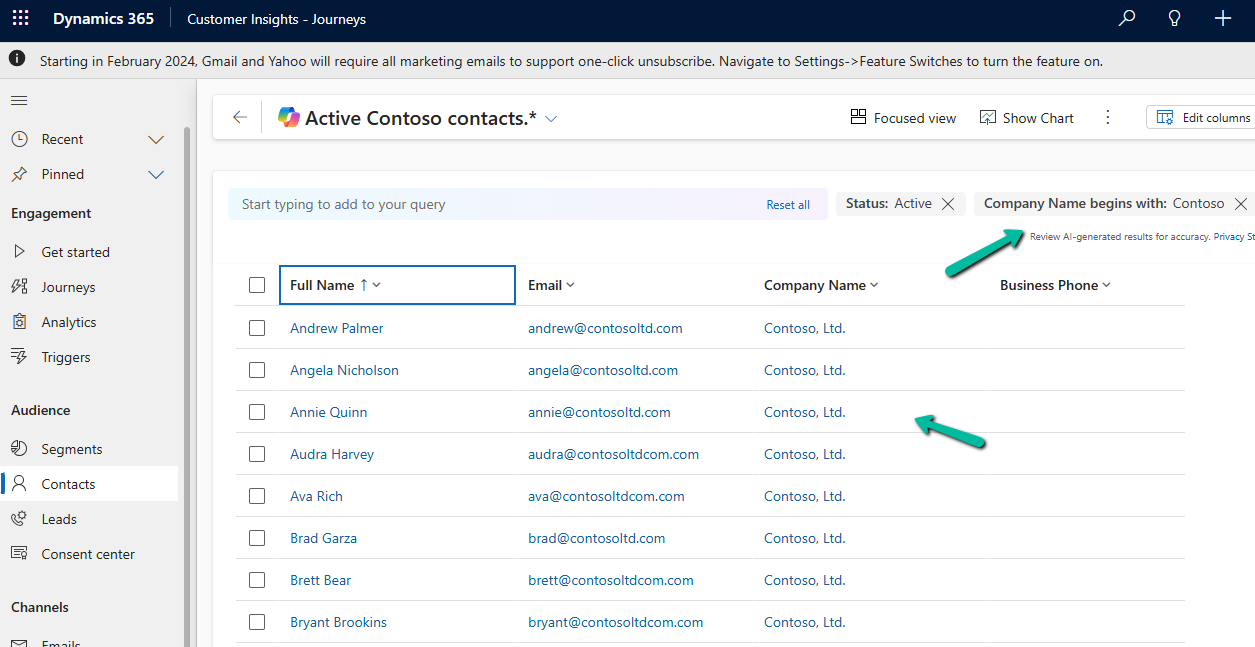
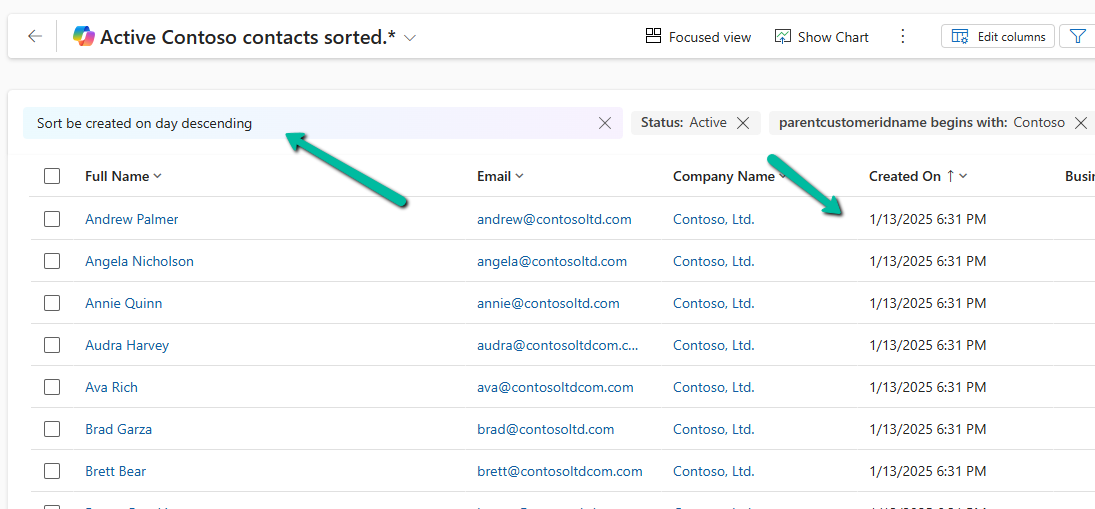
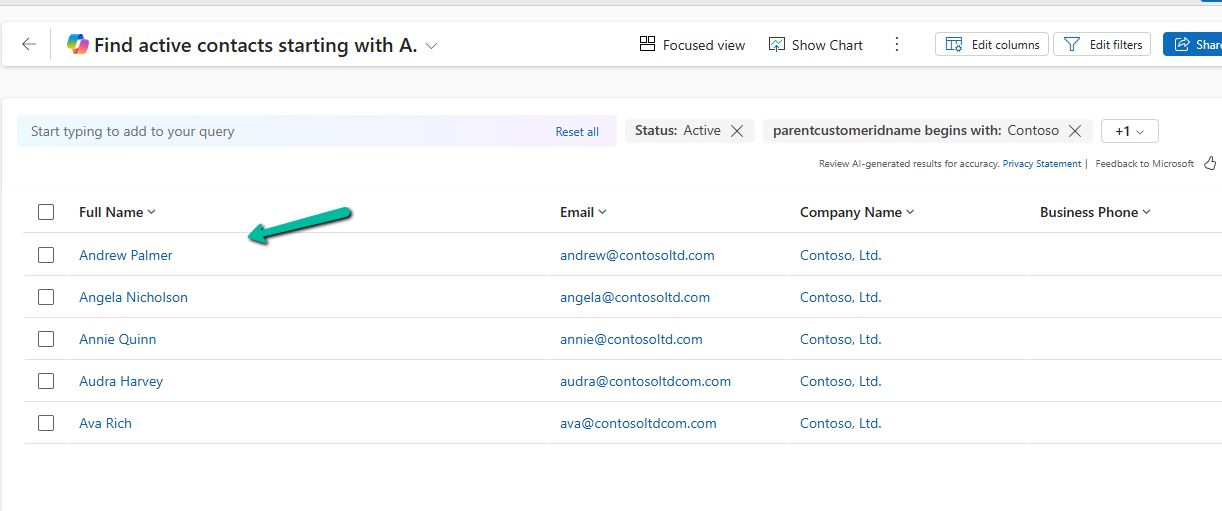
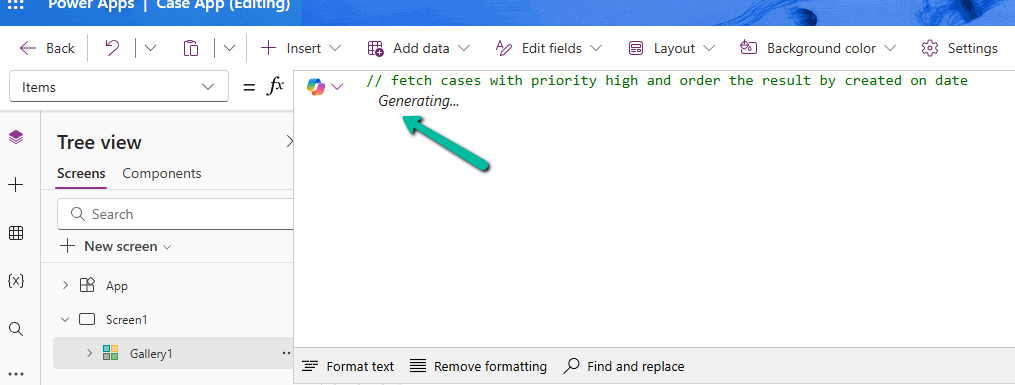
We can also use natural language to specify the data or can select AI-generated suggestions for the views.

More on Natural Language Grid and View Search – https://nishantrana.me/2025/02/04/check-out-the-natural-language-grid-and-view-search/

A screenshot of a computer

AI-generated content may be incorrect.

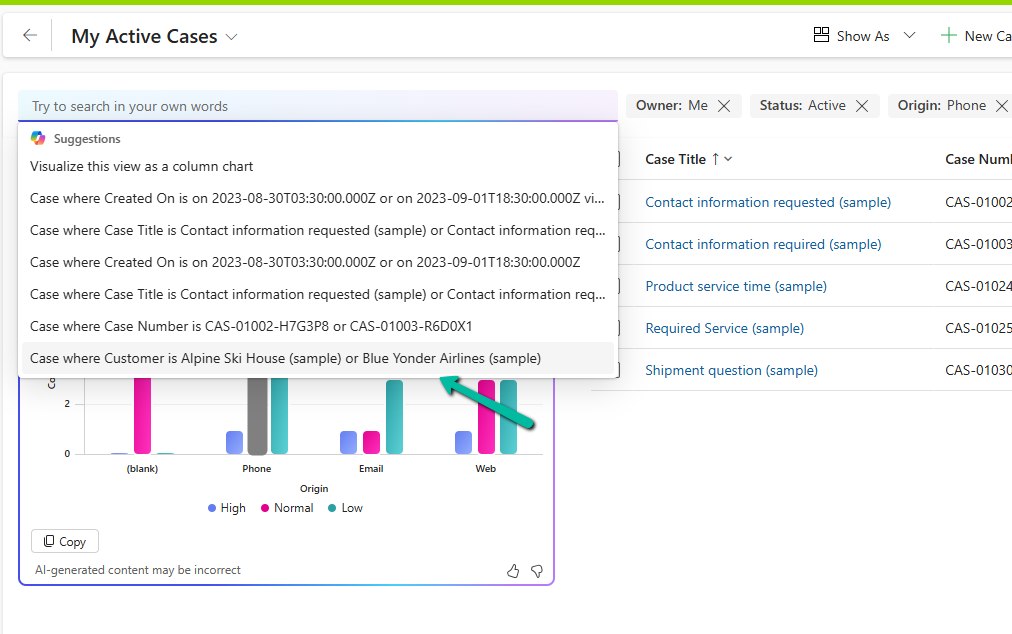
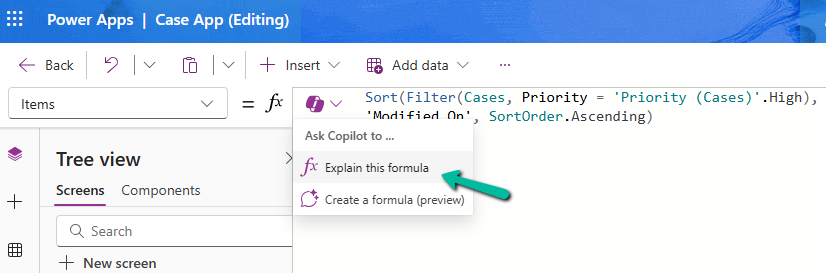
Here we selected/specified the query “Cases where customer is Alpine Ski House” and the Chart and View updated accordingly.

A screenshot of a computer

AI-generated content may be incorrect.

This Copilot-driven data visualization feature is a game-changer for users who need quick insights from their data without setting up complex reports. With just a few clicks and simple queries, Power Apps can now deliver meaningful charts on the fly.

Get more information

Hope it helps..

Advertisements

How to – Configure Copilot Row Summary for tables main form – Dataverse / Dynamics 365


We all know how frustrating it can be to dig through records just to find key details. With AI-generated record summaries, users can instantly access important information—saving time, reducing effort, and boosting productivity.

We can now create AI-powered record summaries for any table in Power Apps using a simple, guided prompt builder. We get to choose the fields and details that matter most, ensuring users see the right information briefly. There’s even an online testing option to fine-tune the summary before rolling it out. Once set up, the record summary will be readily available in forms, making information access effortless.

To enable it inside the Power Platform Admin Center, select an environment and navigate to

Environment >> Settings >> Features >> AI insights cards

Inside Maker Portal, select the table, and from the Customizations section select the Row summary option.

A screenshot of a computer

AI-generated content may be incorrect.

In the Prompt box, we can specify the columns we want to include as part of the summary.

We can click on +Add data to do so can type the name of the field after “/

A screenshot of a computer

AI-generated content may be incorrect.
A screenshot of a computer

AI-generated content may be incorrect.

After specifying the fields, we can click on the Test prompt to see the response. And can fine tune it further.

A screenshot of a computer

AI-generated content may be incorrect.

Clicking on Apply to main forms applies to all the main forms for the table.

A screenshot of a computer

AI-generated content may be incorrect.

We can see the icon added next to the main forms.

A screenshot of a computer

AI-generated content may be incorrect.

The Row summary toolbar allows us to show, hide, and edit the summary.

A screenshot of a computer

AI-generated content may be incorrect.

Publish the changes.

Below we can see the summary generated for the Contact’s main forms.

Get more details.

Hope it helps..

Advertisements

Check Out the Natural Language Grid and View search


The new Smart Grid Preview feature allows us to find, filter, and sort data with natural language.

To enable it navigate to Environment >> Settings >> Features inside Power Platform Admin Center and turn on Natural Language Grid and View Search.

A screenshot of a computer

Description automatically generated

After enabling it we will see a search box on the grid page where we can type in questions about our data in plain English.

A screenshot of a computer

Description automatically generated

Let’s say we need to find “Contacts from the company Contoso”. Normally, this would mean defining the filters/query. But with the Smart Grid’s natural language search, we just type the request, and the system filters the view accordingly.

A screenshot of a computer

Description automatically generated

The result –

A screenshot of a computer

Description automatically generated

We can also use it to sort data.

A screenshot of a computer

Description automatically generated

Another example

A screenshot of a computer

Description automatically generated

The result –

A screenshot of a computer

Description automatically generated

Using natural language search has loads of benefits:

  • Ease of Use: Do complex searches without needing to be tech-savvy.
  • Speed: Find what you need quickly without navigating through multiple filters.
  • Accessibility: Makes data interaction easy for everyone, even if you’re not a tech pro.

As it’s still in preview, there are a few things the Smart Grid Preview doesn’t support yet:

  • Query Aggregation
  • Query Grouping
  • Adding Columns

Remember, it’s still a work in progress and not ready for full production use.

Get more details here

Hope it helps ..

Advertisements

Using Copilot to Create and Explain Formulas – Power Apps


Using the new features – Create a formula (preview) and Explain this formula we can now easily write, edit, and understand formulas in Power Apps.

To enable it, navigate to switch on – Settings >> Updates >> Preview >> Copilot for formulas

Here in the sample app below, we are trying to set the Items property of the Gallery using Create a formula. Here our gallery control is bound to Cases as the data source.

A screenshot of a computer

Description automatically generated

We can describe what formula we need in plain language.

A screenshot of a computer

Description automatically generated

We can see it generating the formula for us. We have the option to Apply, Discard, and Copy it.

A computer screen with a blue background

Description automatically generated

Here we have applied the generated formula.

A screenshot of a computer

Description automatically generated

Another example is where we are setting the Text property.

Here instead of the customer name it considered the Customer Contacted field. So basically we need to review the formula generated.

A screenshot of a computer

Description automatically generated

We can also generate formula from code comments as show below. Simply type the comment and wait for formula to be generated or otherwise press Enter.

The result

Next using Explain this formula we can use the copilot’s ability to explain the formula in plain language.

The result

A screenshot of a computer

Description automatically generated

We can also select specific parts of the formula for explanation.

Below we have selected the Filter keyword and Explain this selection option.

A computer screen with text and arrows pointing to the right

Description automatically generated

The result

A screenshot of a computer

Description automatically generated

Similarly, on selecting SortOrder

A computer screen shot of a computer screen

Description automatically generated

The result

A close-up of a text

Description automatically generated

Get all the details here

Hope it helps..

Advertisements

Field suggestions by Copilot –Power Apps (Dataverse)


Field Suggestions by Copilot for Canvas Apps apply to Gallery, Form Table controls both classic and modern for Dataverse, SharePoint, or SQL Server data source. It analyzes the schema of the table selected and recommends up to 10 fields that also include a maximum of 10 required fields of that table.

Let us see it in action.

Below we have the following fields defined as required fields in the lead table.

A screenshot of a computer

Description automatically generated

Now inside CanvasApp when we insert and bind the Modern Form / Table or the classic Edit Form / Display Form, Data Table to the lead table it automatically suggests the fields for binding.

Here we have selected Lead as the Data Source for the Edit form or Form (modern) control.

Here we can see it suggesting all the required fields of the lead along with other key fields of lead like City, Country, Email, First Name, etc.

In the case of Table, we can see it suggesting the following 10 fields.

A screenshot of a computer

Description automatically generated

In the case of a custom table with very few fields in it, it suggested the below fields for Form and Table control.

A screenshot of a computer

Description automatically generated

Get all the details here.

Hope it helps..

Advertisements

Using the Smart Paste (Preview) feature to fill the form fast in Dataverse / Dynamics 365


To enable this feature navigate to Power Platform Admin Center > Environment > Features > Enable smart paste (preview)

With the smart paste feature, we can copy the text to the clipboard that has the details we want to fill in for our form and click the smart paste button or use our normal CTRL + V. Copilot will analyze the pasted text and will provide suggestions for the different fields on the form.

Suppose we have copied the below text from an email received–

Below we have selected the Smart paste button.

We can see the notification that the Smart Paste is analyzing the clipboard data.

A screenshot of a computer

Description automatically generated

And can see it populating the suggestions for most of the fields from the text we had copied.

We can click on Accept all suggestions or select it for the individual fields.

A screenshot of a computer

Description automatically generated

On Accept all suggestions we can see the values auto-filled from the copied text in clipboard –

Get more details

Hope it helps..

Advertisements